Discover the top 5 scalping trading indicators that deliver fast and accurate signals. Boost your intraday trading profits using these expert-approved scalping tools. Learn how to use RSI, EMA, MACD & more for high-speed trading setups. Improve your win rate in scalping with indicators tailored for quick market moves.
- Central Pivot Range (CPR)
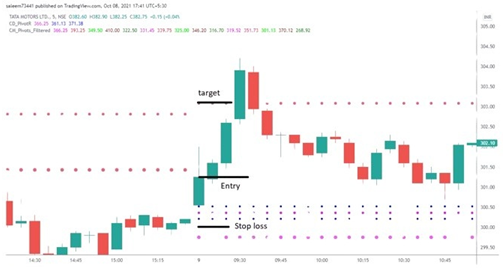
CPR, or Central Pivot Range, is a technical tool used to identify intraday support and resistance levels. It includes:
- Central Pivot Point (CP): Calculated as the average of the previous day’s high, low, and close.
- Support Levels (S1, S2, S3): Zones below the pivot where price might find support.
- Resistance Levels (R1, R2, R3): Zones above the pivot where price might face resistance.
Traders monitor these levels to make swift decisions when prices test or react to pivot points.
- VWAP (Volume-Weighted Average Price)
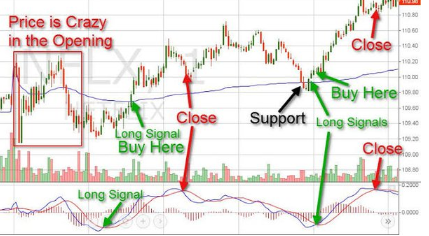
VWAP, the Volume Weighted Average Price, calculates the day’s average traded price, weighted by volume.
- Calculation: Total traded value (price × volume) divided by total volume over a period.
- Purpose: Highlights the stock’s average trading price, reflecting its market sentiment.
- Usage: Prices above VWAP suggest bullishness; prices below indicate bearishness.
VWAP is a key reference for entry/exit points and market direction assessment.
- Parabolic SAR
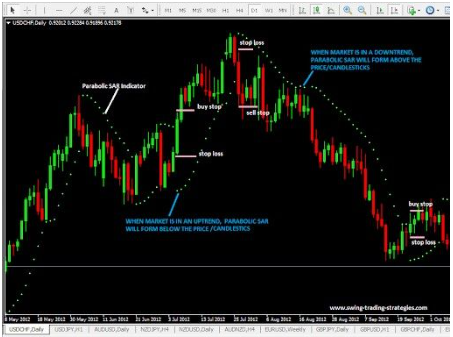
The Parabolic Stop and Reverse (SAR) identifies trend reversals and aids in setting stop-losses.
- Calculation: Plotted dots above (downtrend) or below (uptrend) the price chart.
- Trend Reversal: Dots flip sides when trends reverse, signaling a potential entry or exit.
- Usage: Helps define trailing stop-loss levels and generates buy/sell signals.
While reliable in trends, it may give false signals in sideways markets, so combine it with other tools.
- Relative Strength Index (RSI)
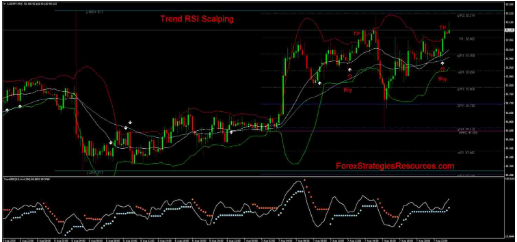
RSI is a momentum oscillator evaluating price movement speed and change.
- Calculation: Based on average gains/losses over a period (commonly 14 days), with results between 0–100.
- Range: RSI above 70 signals overbought conditions; below 30 suggests oversold conditions.
- Usage: Detects potential reversals and validates trends. Divergences between RSI and price may indicate trend weakness or reversal.
- MACD (Moving Average Convergence Divergence)
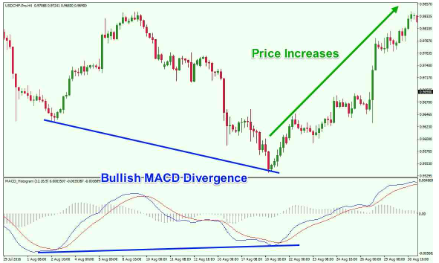
MACD reveals momentum changes and potential trade opportunities.
- Strategy: Monitor MACD line crossing the Signal line.
- Bullish Signal: Buy when MACD crosses above the Signal line.
- Bearish Signal: Sell when MACD crosses below the Signal line.
MACD is ideal for timing entries and exits during quick market moves.
Conclusion
Scalping can be challenging initially but becomes manageable with practice and strategy. There’s no guaranteed success in scalping, but using the right indicators like CPR, VWAP, Parabolic SAR, RSI, and MACD can improve your chances. Always combine multiple tools for more accurate decisions.